
Sensors For Smart Cities
Smart Cities: the use of sensors to help tackle the Urban Heat Island effect
A Data-Science-for-Smart-Cities project carried out with Python | October 24, 2017
Problem Statement: the Urban Heat Island Effect (UHI)

The image above was collected in May 1997 by NASA (source) to show the distribution of temperatures in downtown Atlanta. The majority of the white areas happen to be located on roofs, and a significant contribution is given by the streets (in red). This phenomenon, known as Urban Heat Island effect, is all but new, having first been observed in the early 19th Century. It indicates an increase in temperatures around the city core with respect to the rural areas surrounding it, and it is caused by the introduction of dark surfaces - asphalt, mainly - that absorb the incident solar radiation. This leads to an increase in temperature on the surface of dark objects, which in turn produces a spike in the thermal radiation they emit back into the air. Rooftops and roads are particularly good heat absorpters, due to the presence of asphaltene.

A look into the typical values of thermal conductivity quantifies the extent to which concrete and asphalt are serious contributors, their contribution being amplified by the dense spatial presence of roads and rooftops.
| Thermal Conductivity [W/(m K)] | |
|---|---|
| Material | Value |
| Asphalt | 0.75 |
| Bricks | 0.47 |
| Concrete, medium | 0.4 - 0.7 |
| Concrete, dense | 1.0 - 1.8 |
| Soil with organic matter | 0.15 - 2.0 |
| Wood | 0.07 - 0.17 |
As pointed out by the NASA Earth Observatory, the UHI effect triggers a negative climatic effect. Urban landscapes may experience temperatures between 3.5°C and 4.5°C higher than the surrounding landscapes, resulting in warmer and unstable layers of air that can hold more moisture. Research has demonstrated that this increases the frequency of more extreme rainfall events in the summer in the Northern Hemisphere. As a result, the risk of floods may increase.
The Los Angeles solution

The Mayor of Los Angeles has recently committed to painting some of the city streets in a light shade of grey (pictured above, courtesy of the Bureau of Street Services) in an attempt to cut the UHI effect. As reported by the press, the ambition is to decrease urban temperatures by as much as 1.67°C over the next two decades. The plan is to use a specific coating that, in a pilot experiment, has led to a decrease in road surface temperature of 4.5°C. Apparently, this solution could potentially offset the projected increase reported by NASA and exceed the ambition of the Bureau of Street Services. However, the financial side of things is not equally promising, as the cost of the specific coating to be used is estimated to be around $40,000 per mile. Moreover, the Bureau of Street Services is responsible for maintaining 6,500 miles of streets and 800 miles of alleys, accounting for the largest street system in the United States at the municipal level. Having to allocate $260 million to coat the streets (while neglecting the alleys) is probably haunting the dreams of city officials. The answer may lie in a decision-making tool to identify areas to prioritise, allowing to create a strategic investment plan.
How Big Data from Smart Infrastructures can enable Smart Decisions
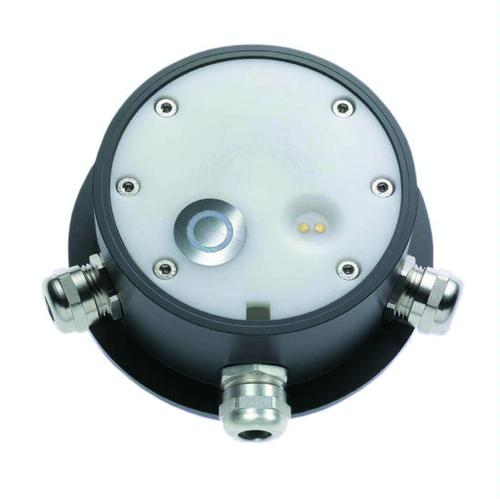
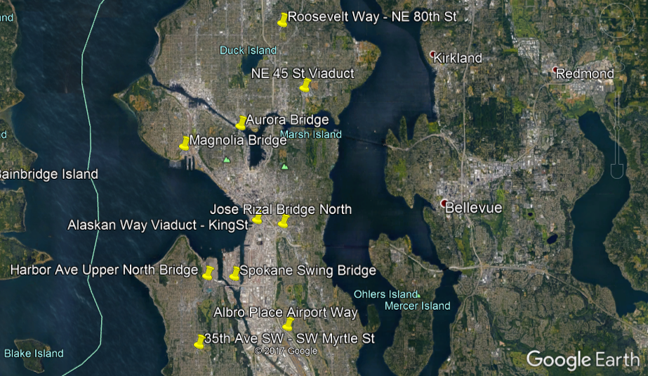
Manufacturers and suppliers of sensors have already started supplying devices (picture above) that can measure road surface temperatures at very short intervals of time. These datasets are an ideal component of open datasets that cities could make available. This project was carried out using the open data made available by the City of Seattle Open Data Portal, which records data for 10 bridges and road intersections (pictured below) every minute. Ideally, sensors should be placed at each intersection and on each bridge. However, the cost of installing dense networks and the lack of awareness are probably the reasons why extended datasets are rather difficult to find.
Taking advantage of Python
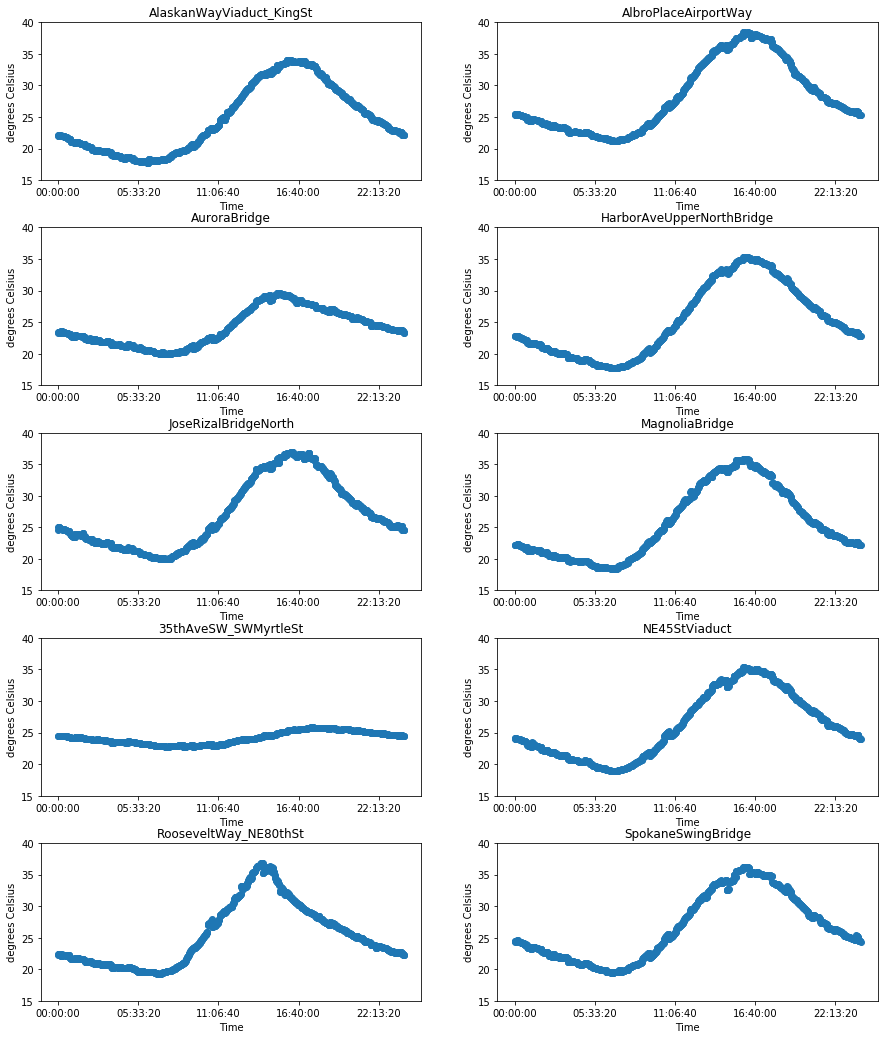
This project takes advantage of the Python programming language and its packages dedicated to Big Data Analytics. The City of Seattle road surface temperatures come in a .csv file of 2.26GB and span the 03/03/2014 to 24/10/2017 period, with over 700,000 measurements. To avoid memory issues, the script associated with this project loads the file as an high-performance, very large data frame and queries it. On average, the hottest month in Seattle is August, and as such, all data outside this window are dropped to save memory. A quick look at the average temperature values for 1-minute intervals reveals the sine wave trends for August 2016:
| Average Peak Time of Road Surface Temperature | |
|---|---|
| Bridge | Time |
| 35th Avenue SW - SW Myrtle Street | 17:35 |
| Alaskan Way Viaduct - King Street | 15:55 |
| Albro Place Airport Way | 15:55 |
| Aurora Bridge | 15:21 |
| Harbor Avenue Upper North Bridge | 16:08 |
| Jose Rizal Bridge North | 16:10 |
| Magnolia Bridge | 15:51 |
| NE 45th Street Viaduct | 15:54 |
| Roosevelt Way - NE 80th Street | 14:05 |
| Spokane Swing Bridge | 16:10 |
Except for the 35th Avenue SW - SW Myrtle Street location, which is not a bridge but an intersection, all average peak times are between 2:05PM and 4:10PM, with a group of values gathered around 3:55PM. This concentration does not occur in a specific area of the city, and the different peak times may be a result of shadowing buildings. As a representative case, the 3:50PM-4:10PM interval is considered as the de facto average peak time given its recurrence. Depending on the case, specific times may be chosen, especially if the study targets a specific sensor or group of sensors. The maximum average road surface temperature for the month of August 2016 in the 3:50PM-4:10PM time frame is shown below.
| Maximum Average Road Surface Temperature [°C] | |
|---|---|
| Bridge | Value |
| 35th Avenue SW - SW Myrtle Street | 25.34 |
| Alaskan Way Viaduct - King Street | 33.94 |
| Albro Place Airport Way | 38.35 |
| Aurora Bridge | 29.17 |
| Harbor Avenue Upper North Bridge | 35.32 |
| Jose Rizal Bridge North | 36.77 |
| Magnolia Bridge | 35.77 |
| NE 45th Street Viaduct | 35.19 |
| Roosevelt Way - NE 80th Street | 31.71 |
| Spokane Swing Bridge | 36.15 |
These temperatures are much lower than those recorded for Los Angeles, although the average number of sunny days in Seattle is only 46.47% of what Los Angeles typically experiences. The different latitudes should be accounted for as well.
Interactive plotting
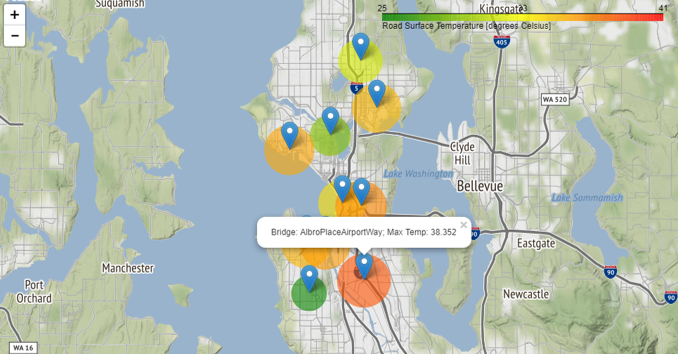
The interactive package Folium is an elegant way to create an interactive plot of the maximum average road surface temperatures using the City of Seattle base map. This map would come with a much finer resolution if a denser network of sensors was available. Also, a densely populated map could help visualize how these temperatures are distributed across the city, to improve the effectiveness of decision-making. However, given the coarse resolution of the available datasets, this project aims at showing what could be produced if larger data were available. The image below shows the spatial distribution of road surface temperatures in the 10 locations available. Its interactive nature is best appreciated by looking at the source Jupyter script, where it is possible to zoom in, click, and read the details of each bridge.
Conclusion
In the context of a strategic investment plan, this short project allows to identify the bridges that should be coated first based on a (coarse) network of road surface temperature sensors. The 10 bridges included in this pilot study certainly are a non significant sample: amounting to an overall length of 5.1 miles, they are a negligible portion of the over 3,900 miles of paved roads that compose the Seattle’s urban texture. In this limited sample, there does not seem to be any particular spatial bias. The Albro Place Airport Way bridge stands out as a remarkable contributor relative to other locations, whereas the 35th Avenue SW - SW Myrtle Street junction is on the other side of the spectrum, and it would be ignored by the investment plan. Again, if a denser network was available, the Seattle City Council could select a fraction of the roads that emit the most heat. This would be possible because a denser network could produce measurements at short distances, resembling a grid. The purchase and installation of sensors is only the early stage of a costly process, which burden could probably be lightened by the use of a fleet of drones equipped with thermal cameras. Whatever the cost, however, it seems that the era of Digital Transformation and IoT that is fastly approaching the world of Civil Engineering asks for a radical change in perspective, wise investment plans, and does not take no for an answer.