
Food Hygiene Ratings In The United Kingdom
Where are the dirtiest restaurants and hotels in the United Kingdom? How many of them failed to achieve maximum food hygiene ratings?
A Data Science project carried out with Jupyter and Python | May 11, 2017
Intro
Eating safe food is not always a given. While sitting at the table of a restaurant, I have seen a fair number of people being utterly disgusted by the sight of a hair in the burger or fish, a greased knife, or a glass (unexpectedly) embellished by lipstick stains. Bill Bryson would be glad to know that sometimes all of these had devilishly gathered at the same table. The reaction is always the same, because in one way or another, we are all concerned with hygiene when we visit a restaurant, a hotel, a pub, or any other place (especially if we have to pay).
In the United Kingdom, as well as in most Countries, this matter is taken seriously by the Government. In 2001, following the proposal of a detailed report, the Food Standards Agency was formed, the purpose being to screen all businesses that serve food. The idea was to make sure they complied with a set of hygiene standards, so that food always remained safe to eat.
In Scotland, food hygiene standards are overseen by Food Standards Scotland, while in the rest of the United Kingdom they are enforced by the Food Standards Agency.

Images found here and here.
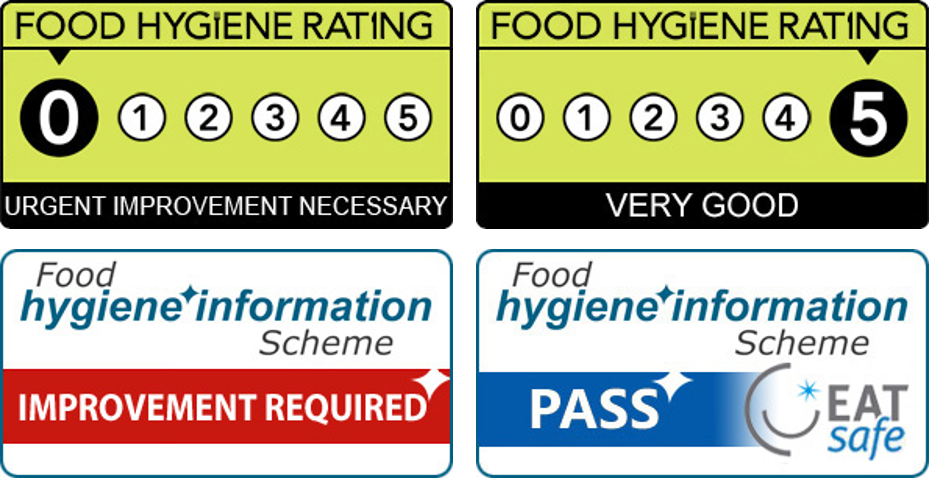
As of May 2017, there are 47,477 businesses to be screened in Scotland, and 469,897 in the rest of the United Kingdom, including Northern Ireland. This is a huge cohort, and the task is accomplished using two different schemes: the Food Hygiene Information Scheme (FHIS) in Scotland and the Food Hygiene Rating Scheme (FHRS) in the rest of the United Kingdom. The first uses categorical descriptors that are directly assigned to each business (Table 1), while the second adopts a points scheme that assigns high scores to poor hygiene conditions (Table 2).
| Scotland (FHIS) | |
|---|---|
| 1 | Pass and Eat Safe |
| 2 | Pass |
| 3 | Improvement Required |
| 4 | Awaiting Publication |
| 5 | Awaiting Inspection |
Table 1 - Ratings for Scotland
| Rest of the UK (FHRS) | |
|---|---|
| Hygiene score | Hygiene rating |
| 0-15 | 5 |
| 20 | 4 |
| 25-30 | 3 |
| 35-40 | 2 |
| 45-50 | 1 |
| >50 | 0 |
Table 2 - Ratings for the rest of the UK
Parsing xml files from the Food Standards Agency website
To figure out which areas of the UK host the dirtiest businesses food-wise, it is necessary to parse the Food Standards Agency website, where data are publicly available to download. These come in the form of xml files that are grouped by region and local authority (Scotland is included). Given the different rating system in place for Scotland, a separate analysis is required, and the results will not be adjusted to those of the rest of the UK.
This section is about:
- Scraping the Food Standards Agency html page to extract the file names to be downloaded;
- For each region on the html page, downloading a zip folder containing only the relevant xml files.
Python makes it easy to do both. We can scrap websites with the BeautifulSoup package. All we need to do is define an url, and we can use urllib2 for this. Then, the download can be performed using a list of file names produced parsing the html page, as BeautifulSoup needs to know which files we need. In the end, a zip folder will be created for each region on the html page, with each folder containing only the relevant xml files.
from __future__ import division
import urllib2
from bs4 import BeautifulSoup
import os
import zipfile

#Set project folder
myfolder = r'C:\Users\MyName\MyFolder' #Change as appropriate
os.chdir(myfolder) #Get inside the project folder

#Set the url of a website
url = 'http://ratings.food.gov.uk/open-data/'
f = urllib2.urlopen(url)
mainpage = f.read()

#Get the list of file names to download
soup = BeautifulSoup(mainpage, 'html.parser')
tablewrapper = soup.find(id='openDataStatic')
regions = []
filenames = {} #Dictionary with {Region:[list of file names]}
with open('Regions_and_files.csv', 'w') as f:
    f.write("Region,City,File,Businesses"+'\n')
    for h2 in soup.find_all('h2')[6:]:
        temp = [] #Stores the links for each region
        region = h2.text.strip() #Get the text of each h2 without the white spaces
        regions.append(str(region))
        table = h2.next_sibling.next_sibling
        for tr in table.find_all('tr')[1:]: # Skip headers
            tds = tr.find_all('td')
            if len(tds)==0:
                continue
            else:
                a = tr.find_all('a')
                link = str(a)[10:67]
                span = tr.find_all('span')
                businesses = int(str(span[3].text).replace(',', '')) #Number of businesses for each local authority
                if "cy" not in link:   #Avoiding files in Welsh
                    temp.append(link)
                    f.write("%s,%s,%s,%s" % \
                                  (region,str(tds[0].text)[1:-1], link, businesses)+'\n')
        filenames[region] = temp

#Parsing the html page and saving the xml files to the appropriate folder based on the region
for key, value in filenames.iteritems():
    zipname = str(key)+".zip" #str(key) contains the name of the region
    with zipfile.ZipFile(zipname, "w") as code:
        for url in filenames[key]:
            f = urllib2.urlopen(url)
            data = f.read()
            xmlfilename = url.rsplit('/', 1)[-1]
            code.writestr(xmlfilename, data)
Once we have the zip folders, we need to extract all the files in a folder with the same name as the zip folder. A quick manipulation of the Regions_and_files.csv file will reveal how many businesses are subjected to the standards in each part of the UK:
#Create dataframe with recap data and bar plot
import pandas
import matplotlib.pyplot as plt

df = pandas.read_csv("Regions_and_files.csv")
df.groupby('Region')['Businesses'].sum()
df2 = pandas.Series.to_frame(df.groupby('Region')['Businesses'].sum())
ax = df2.plot(kind='bar',title='Number of Businesses per Region in the UK, 2017',zorder=3)
ax.grid(zorder=0,linestyle='--',linewidth=0.5)
plt.xticks(fontsize=8)
plt.tight_layout()
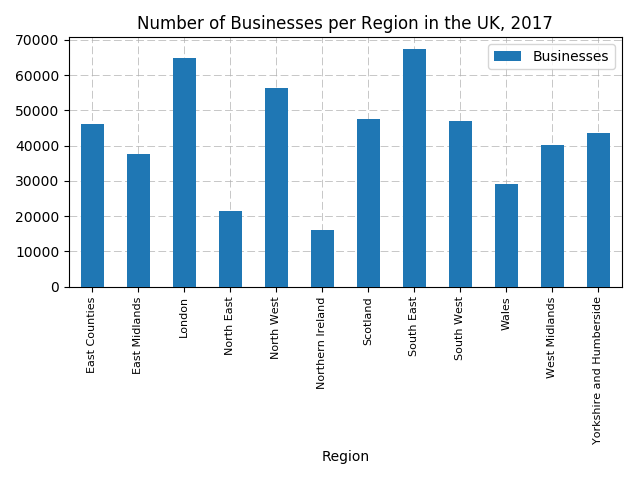
Figure 1
Surprisingly, Greater London is not the one with the highest number of businesses. These are instead located in the South East (67,401 different places scattered across cities such as Southampton, Oxford, Portsmouth, Canterbury, and many others). London comes next at 64,897. The least represented region is Northern Ireland, with 16,135 businesses.
Each file in the Scotland folder has the hygiene descriptor under the RatingValue tag, whereas the files for the rest of the UK have the hygiene score under the Hygiene tag. So, we need to loop through each file and get a hold of these values.
import xml.etree.ElementTree as ET

#Dictionary with ratings
ratings = {} #UK except Scotland
scotland = {} #Different rating system

tot_businesses = 0 #Count the number of businesses in the UK except Scotland

#Parsing the xml files in their individual directories
path = r'C:\Users\MyName\MyFolder\Files' #Change as appropriate
for root, dirs, files in os.walk(path,topdown=True):
    gb_vals = [] #Stores the ratings for each region (=root)

    #Check Scotland, as it has a different rating scheme
    if root=='C:\\Users\\MyName\\MyFolder\\Files\\Scotland': #Change as appropriate
        #Scottish ratings are categorical
        passed = 0
        passed_safe = 0
        improve = 0
        for file in files: #For each City/Area in Scotland
            if not file.endswith('.xml'): continue
            fullname = os.path.join(root, file)
            print fullname[65:]
            tree = ET.parse(fullname)
            treeroot = tree.getroot()
            for each in treeroot.findall('.//EstablishmentDetail'):
                councilarea = each.find('.//LocalAuthorityName')
                council = councilarea.text
            for each in treeroot.findall('.//EstablishmentDetail'):
                rating = each.find('.//RatingValue')
                #Skip the rare situations of exempt businesses or similar
                if rating.text=='Exempt' or rating.text=='Awaiting publication' or rating.text=='Awaiting inspection' or rating is None:
                    continue
                else:
                    if rating.text=='Pass and Eat Safe':
                        passed_safe+=1
                    if rating.text=='Pass':
                        passed+=1
                    if rating.text=='Improvement Required':
                        improve+=1
            perc1 = round(100*improve/(improve+passed_safe+passed),3) #Percentage of negative businesses
            scotland[council] = perc1 #Saving values in the dictionary

    else: #All the other Regions
        for file in files: #For each City/Area in the Region
            count = 0 #Count number of non excellent businesses
            if not file.endswith('.xml'): continue
            fullname = os.path.join(root, file)
            print fullname[65:]
            tree = ET.parse(fullname)
            treeroot = tree.getroot()
            for each in treeroot.findall('.//Header'):
                businesses = each.find('.//ItemCount')
                tot_businesses = tot_businesses + int(businesses.text)
            for each in treeroot.findall('.//Scores'):
                rating = each.find('.//Hygiene')
                if rating is None:
                    continue
                if int(rating.text)>=20: #Percentage of negative ranks
                    count+=1
            perc2 = round(count/int(businesses.text),3)
            gb_vals.append(perc2) #Get the rating value

        region_name = str(root[65:]) #Getting the name of the Region as a text string
        ratings[region_name] = gb_vals #Saving values in the dictionary

#Average ratings per region, UK except Scotland
avg_gb = {k:round(100*sum(i)/len(i),3) for k,i in ratings.items() if len(i)>0}
Plotting data
Now it’s time to plot the data acquired from the xml files. The geographer’s soul that’s in me calls for them to be put on a nice map. Instead of using the Python package Basemap, I want to load and display some shapefiles, because they allow me to select the appropriate administrative boundaries to show. Since this is a separate analysis, there are two dedicated shapefiles: one for Scotland and one for the rest of the UK.
Drawing inspiration from here, we can now plot a cloropleth map showing the areas of the UK and Scotland where the percentage of poor food hygiene ratings is highest. The definition of “poor” in both cases refers to non-complaint businesses:
- For Scotland, we can use the dedicated “Improvement Required” rating tag and count their frequency for each council area. This will give us the percentage of non-compliant businesses in each council area:
- For the rest of the UK, we can assume that non-compliant businesses are given a score of at least 20. We count such occurrences for and average their number to get the percentage of non-compliant businesses for each region:
#Plotting
import cartopy.crs as ccrs
import matplotlib.pyplot as plt
import matplotlib as mpl
import cartopy.io.shapereader as shpreader

#Scotland
#Set projection and colormap
fig, ax = plt.subplots(subplot_kw={'projection': ccrs.OSGB()})
norm = mpl.colors.Normalize(vmin=min(scotland.values()), vmax=max(scotland.values()))
cmap = plt.cm.RdYlBu_r

#Loop over the shapes
for n, country in enumerate(shpreader.Reader(r'C:\Users\MyName\MyFolder\Scotland\Scotland_with_council_areas.shp').records()):

    ax.add_geometries(country.geometry, ccrs.OSGB(),
                      facecolor=cmap(norm(country.attributes['Hygiene'])),
                      label=country.attributes['geo_label'],edgecolor='black',linewidth=0.3)

#Image polishing
ax.set_title('Non-compliant businesses in Scotland, %')
ax.set_extent([5513.0004, 470323.0000, 530252.8000, 1220301.5006], ccrs.OSGB())
plt.xlabel("Easting [m]")
plt.ylabel("Northing [m]")

#Colorbar
cax = fig.add_axes([0.8, 0.15, 0.03, 0.7]) #Position
cb = mpl.colorbar.ColorbarBase(cax, cmap=cmap, norm=norm, spacing='proportional')
cb.set_label('%')
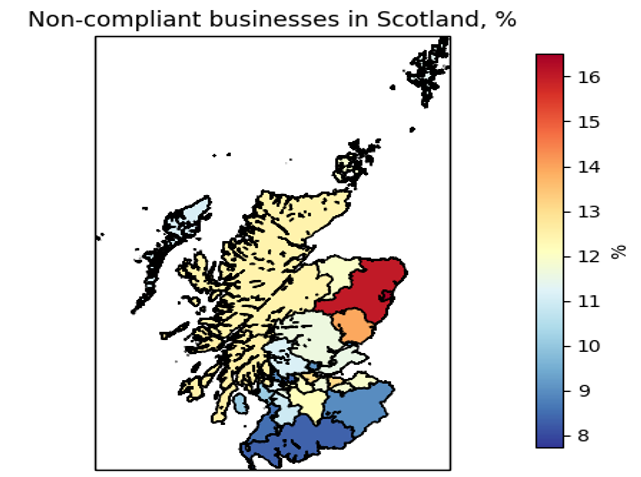
Figure 2
In Scotland, it looks like hat the worst place to go out for lunch or dinner is Aberdeen, where 16.52% of the 1,764 targeted businesses are non-complaint as of May 2017. In Eastern Scotland there seems to be a cluster of bad practice: in fact, Aberdeenshire comes right behind with 13.81% non-compliant businesses, followed by the Angus council area (12.25%). Based on this analysis, this is an area where Food Standards Scotland should probably urge the owners to better comply with its standards. The parts of Scotland closer to England offer a much better landscape in terms of food standards, with Dumfries and Galloway showing a 7.72% of non-compliant businesses - a 53% reduction compared to the city of Aberdeen.
#Rest of the UK
#Set projection and colormap
fig, ax = plt.subplots(subplot_kw={'projection': ccrs.OSGB()})
norm = mpl.colors.Normalize(vmin=min(avg_gb.values()), vmax=max(avg_gb.values()))
cmap = plt.cm.RdYlBu_r

#Loop over the shapes
for n, country in enumerate(shpreader.Reader(r'C:\Users\Francesco\Desktop\Data_Science_portfolio\20170511\UK_except_Scotland\UK_except_Scotland.shp').records()):

    ax.add_geometries(country.geometry, ccrs.OSGB(),
                      facecolor=cmap(norm(country.attributes['Hygiene'])),
                      label=country.attributes['NAME'],edgecolor='black',linewidth=0.3)

#Image polishing
ax.set_title('Non-compliant businesses in the UK, %')
ax.set_extent([-69.1254, 655988.9963, 5333.6025, 657599.5034], ccrs.OSGB())
plt.xlabel("Easting [m]")
plt.ylabel("Northing [m]")

#Colorbar
cax = fig.add_axes([0.85, 0.15, 0.03, 0.7]) #Position
cb = mpl.colorbar.ColorbarBase(cax, cmap=cmap, norm=norm, spacing='proportional')
cb.set_label('%')
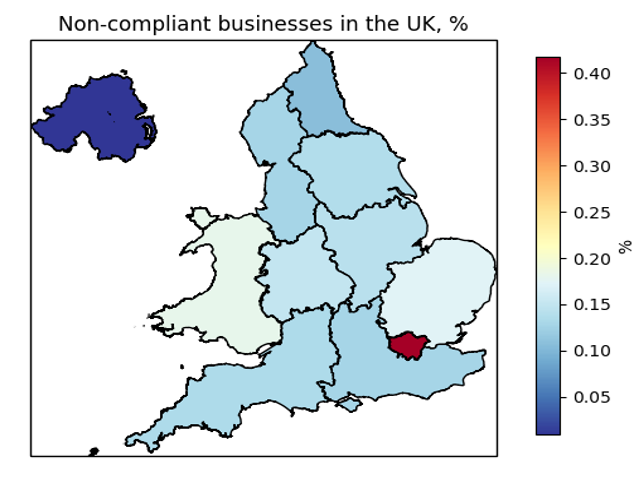
Figure 3
In the rest of the United Kingdom and in Northern Ireland, the numbers are different because of the different rating scheme. However, it looks like that the overall non-compliance comes with very low numbers. Northern Ireland itself seems to be the safest place to be served food, where an average of 0.009% of businesses has an hygiene rating of at least 20. The second-best performing region is the North East, where the average non-compliant businesses are 0.108%. However, unlike in Scotland, no spatial pattern can be recognizable, and it is worth mentioning Greater London as the worst region. There, an average of 0.418% of all businesses are non-compliant with food hygiene regulations.
Of course this analysis is informative, but coarse. What if we zoom in on large cities? Again, due to the different rating systems, we need to run two separate analyses. Let’s consider the largest cities in Scotland (Glasgow, Edinburgh, Aberdeen, Dundee, and Paisley), and those in the rest of the UK (Birmingham, Leeds, Sheffield, Bradford, Liverpool, Manchester, Cardiff, Belfast, and Newcastle upon Tyne). For Greater London, we already know that an average 0.418% of all businesses are non-complaint, so we can consider this value admissible. For the other cities, a quick look at the source page of the Food Standards Agency website will allow us to identify the associated xml file:
#Scotland
sco={'Glasgow':'FHRS776en-GB.xml','Edinburgh':'FHRS773en-GB.xml','Aberdeen':'FHRS760en-GB.xml',
     'Dundee':'FHRS772en-GB.xml','Paisley':'FHRS788en-GB.xml'}

#Rest of the UK
rest_of_uk={'Birmingham':'FHRS402en-GB.xml','Leeds':'FHRS413en-GB.xml','Sheffield':'FHRS425en-GB.xml',
            'Bradford':'FHRS404en-GB.xml','Liverpool':'FHRS414en-GB.xml','Manchester':'FHRS415en-GB.xml',
            'Cardiff':'FHRS556en-GB.xml','Belfast':'FHRS807en-GB.xml','Newcastle':'FHRS416en-GB.xml'}
Now we can search the folder with all the xml files and compute the percentage of non-compliant businesses for each city:
#Scotland
cities_sco={}
path = r'C:\Users\MyName\MyFolder\Files\Scotland' #Change as appropriate
for root, dirs, files in os.walk(path,topdown=True):
    for city, xmlfile in sco.iteritems():
        for file in files:
            passed = 0
            passed_safe = 0
            improve = 0
            if file==city:
                fullname = os.path.join(root, file)
                tree=ET.parse(fullname)
                treeroot = tree.getroot()
                for each in treeroot.findall('.//EstablishmentDetail'):
                    rating = each.find('.//RatingValue')
                    #Skip the rare situations of exempt businesses or similar
                    if rating.text=='Exempt' or rating.text=='Awaiting publication' or rating.text=='Awaiting inspection' or rating is None:
                        continue
                    else:
                        if rating.text=='Pass and Eat Safe':
                            passed_safe+=1
                        if rating.text=='Pass':
                            passed+=1
                        if rating.text=='Improvement Required':
                            improve+=1
                perc1 = round(100*improve/(improve+passed_safe+passed),3)
                cities_sco[city]=perc1
And we do the same for the rest of the UK:
#Rest of the UK
cities_gb={}
path = r'C:\Users\MyName\MyFolder\Files' #Change as appropriate
for root, dirs, files in os.walk(path,topdown=True):
    for city, xmlfile in rest_of_uk.iteritems():
        for file in files:
            count=0
            if file==xmlfile:
                fullname = os.path.join(root, file)
                tree=ET.parse(fullname)
                treeroot = tree.getroot()
                for each in treeroot.findall('.//Header'):
                    businesses = each.find('.//ItemCount')
                    tot_businesses = tot_businesses + int(businesses.text)
                for each in treeroot.findall('.//Scores'):
                    rating = each.find('.//Hygiene')
                    #Skip the rare situations of exempt businesses or similar
                    if rating is None:
                        continue
                    if int(rating.text)>=20:
                            count+=1
                perc2 = round(100*count/int(businesses.text),3)
                cities_gb[city]=perc2
Now we turn the two dictionaries cities_sco and cities_gb into dataframes and plot them:
import pandas as pd

cities_sco_df=pd.DataFrame(cities_sco.items(), columns=['City', 'Non-compliant businesses (%)'])
cities_gb_df=pd.DataFrame(cities_gb.items(), columns=['City', 'Non-compliant businesses (%)'])

ax = cities_sco_df.plot(kind='bar', title ="Non-compliant businesses in Scotland, %", figsize=(9, 6), legend=True, fontsize=12,xticks=cities_sco_df.index,rot=0,zorder=3)
ax.set_xticklabels(cities_sco_df.City)
ax.set_xlabel("City", fontsize=12)
ax.set_ylabel("%", fontsize=12)
ax.grid(zorder=0,linestyle='--',linewidth=0.5)
plt.xticks(fontsize=10)
plt.tight_layout()
plt.show()

#Add Greater London to cities_gb_df
df = pd.DataFrame({ 'City' : 'London','Non-compliant businesses (%)' : 0.418},index=[0])
cities_gb_df=cities_gb_df.append(df) #Add the new row
cities_gb_df = cities_gb_df.reset_index(drop=True) #Reset the dataframe index

#And then plot
ax = cities_gb_df.plot(kind='bar', title ="Non-compliant businesses in the rest of the UK, %", figsize=(9, 6), legend=True, fontsize=12,xticks=cities_gb_df.index,rot=45,zorder=3)
ax.set_xticklabels(cities_gb_df.City)
ax.set_xlabel("City", fontsize=12)
ax.set_ylabel("%", fontsize=12)
ax.grid(zorder=0,linestyle='--',linewidth=0.5)
plt.xticks(fontsize=10)
plt.tight_layout()
plt.show()
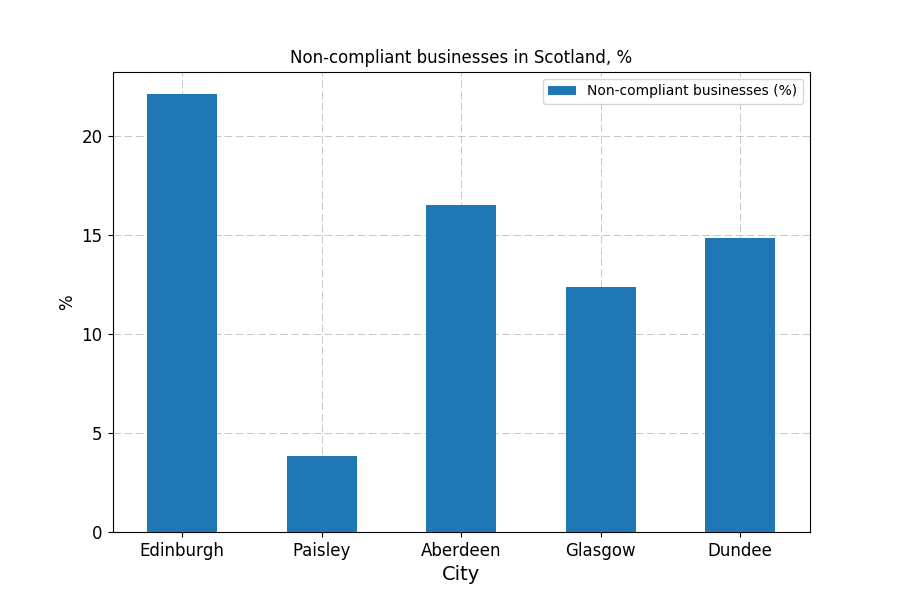
Figure 4
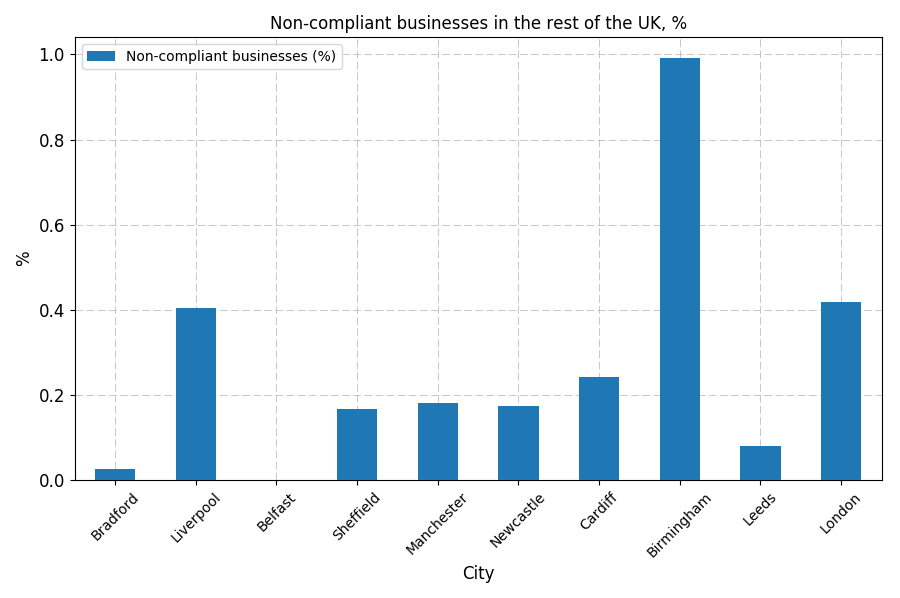
Figure 5
In Scotland (Figure 4), Edinburgh leads the way. Despite the city being visited by millions of tourists each year (in 2016 alone, 12,348,425 passengers transited through the airport), a staggering 22.15% of all businesses are currently non-compliant, as per the criteria used in this analysis. In Glasgow, numbers are better: 12.38% of the 5,209 businesses are a no go.
In the rest of the UK (Figure 5), a different system yields different values. Birmingham is on top of the list: nearly 1% of the subjected businesses have unsatisfactory hygiene ratings. Greater London comes next at 0.418%, and then Liverpool, at 0.404%. The best-performing city seems to be Belfast, where the compliance is 100%. I will once again stress that a “Scotland vs rest of the UK” comparison is absolutely meaningless, given the different systems in use.
London, or technically Greater London, is a box waiting to be opened. It is made of 33 boroughs, for which the average value of 0.418% is too diluted to be significant. A more detailed look at the different boroughs may reveal spatial patterns that are not necessarily known.
#Parsing the xml files in their storage folder
london_ratings={}
path = r'C:\Users\MyName\MyFolder\Files' #Change as appropriate
for root, dirs, files in os.walk(path,topdown=True):

    #This time we seacrh the London folder only
    if root=='C:\\Users\\MyName\\MyFolder\\Files\\London':
        for file in files: #For each borough
            count = 0 #Count number of non excellent businesses
            if not file.endswith('.xml'): continue
            fullname = os.path.join(root, file)
            tree = ET.parse(fullname)
            treeroot = tree.getroot()
            for each in treeroot.findall('.//Header'):
                businesses = each.find('.//ItemCount')
            for each in treeroot.findall('.//EstablishmentDetail'):
                authority = each.find('.//LocalAuthorityName')
                borough = authority.text
                print borough
            for each in treeroot.findall('.//Scores'):
                rating = each.find('.//Hygiene')
                if rating is None:
                    continue
                if int(rating.text)>=20: #Percentage of negative ranks
                    count+=1
            perc2 = round(100*count/int(businesses.text),3)
            london_ratings[borough] = perc2 #Saving values in the dictionary
And now, let’s dive into the last plot of this post using the London Borough shapefile:
#London Boroughs
#Set projection and colormap
fig, ax = plt.subplots(subplot_kw={'projection': ccrs.OSGB()})
norm = mpl.colors.Normalize(vmin=min(london_ratings.values()), vmax=max(london_ratings.values()))
cmap = plt.cm.RdYlBu_r

#Loop over the shapes
for n, country in enumerate(shpreader.Reader(r'C:\Users\Francesco\Desktop\Data_Science_portfolio\20170511\Shapefiles\London_Boroughs\London_Boroughs.shp').records()):

    ax.add_geometries(country.geometry, ccrs.OSGB(),
                      facecolor=cmap(norm(country.attributes['Hygiene'])),
                      label=country.attributes['NAME'],edgecolor='black',linewidth=0.3)

#Image polishing
ax.set_title('Non-compliant businesses in the Boroughs of London, %')
ax.set_extent([503568.2000, 561957.5000, 155850.8000, 200933.9000], ccrs.OSGB())
plt.tight_layout()
plt.xlabel("Easting [m]")
plt.ylabel("Northing [m]")

#Colorbar
cax = fig.add_axes([0.89, 0.15, 0.03, 0.7]) #Position
cb = mpl.colorbar.ColorbarBase(cax, cmap=cmap, norm=norm, spacing='proportional')
cb.set_label('%')
plt.gcf().subplots_adjust(right=0.88)
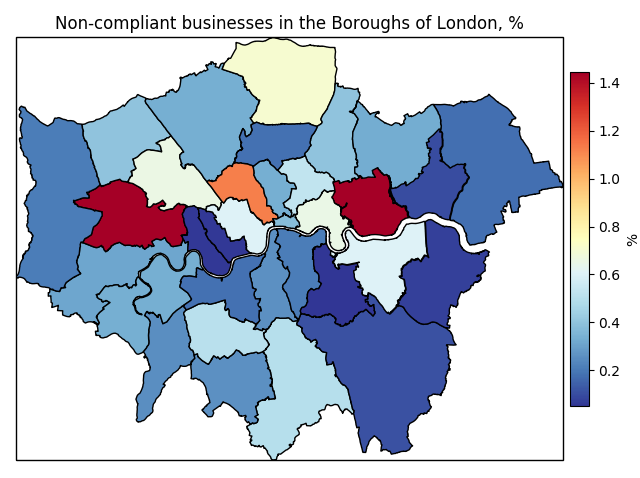
Figure 6
We can deduce from Figure 6 that, generally, London is a very safe place to eat. Obviously there are exceptions, but the overall landscape is very reassuring. The poorest food hygiene ratings in Greater London are north of the Thames, and east and west of the City. In the west end, the London Borough of Ealing showed the lowest ratings, with 1.447% of its subjected business scoring 20 or more points (check Table 2 for clarity). In the east end, the London Borough of Newham showed a similar value, 1.442%. The safest areas where to eat are both in the far east end: in fact, 0.212% of unsatisfactory ratings were observed for the London Borough of Hillingdon, where London Heathrow Airport is located, while for the Royal Borough of Kingston upon Thames the observed percentage was 0.252%.
Conclusion
This analysis has taken advantage of the latest data made available by the Food Standards Agency, which change over time. In the future, therefore, the outcome of this analysis may be different.
In Scotland, some concerns may be raised for the city of Edinburgh, and then for Aberdeen and the surrounding Aberdeenshire, where owners should seriously follow the guidelines of Food Standards Scotland. The council areas closer to England, as well as the Orkney and Shetland Islands, are the best performing ones.
In the rest of the UK, the food standards are quite high pretty much everywhere. Belfast emerged as the palce where the safest food is served, while Birmingham has the highest percentage of unsatisfactory food ratings. In London, although it is generally safe to eat almost everywhere, unpleasant situations may unfold in the boroughs of Ealing and Newham. In the City, the percentage of non-compliant businesses is 0.381%, the 20th highest value among all 33 boroughs.